Dynamically Generating a Cross Tab Report, Part 2
September 12, 2006
Contributed by Nic Guzaldo, Pentaho Community Member
Finally! A couple of weeks ago, I started explaining a technical tip that Nic Guzaldo had submitted, basically outlining how to dynamically generate a crosstab report. Well, here is Part 2 to that article, which will pick up where we left off and complete the article by building the final report.
To refresh your memory (and mine), in the first part of this article, we accomplished the following:
- Looked at a previous tip for migrating the Pentaho sample data from HSQLDb to MySQL.
- Set up a MySQL JNDI connection in JBoss.
- Built the list of selections for columns in our query from row data in the Pentaho sampledata database.
- Built the prompt page to select from the list of columns those we want in our report, as well as selecting a few other parameters for the report.
- Called a sub-action sequence to build and run the final query for our cross tab report.
You can also go back through Part 1 of the article in detail here.
This second article will pick up where we left off. We will use the query that we derived in the first article to feed into a Pentaho report template. Actually, we will use several mini templates that demonstrate template re-use and assembling with parameters, very cool stuff. Our template will have several replaceable parameters that will accommodate our variable number of columns, a dynamically generated report title, and a nice name for any output files we generate, should the user choose to output their report to a format such as Excel, RTF, PDF, etc.
Resources Before You Get Started
Here are the resources that we started with in Part 1 of this article. You will need this environment for Part 2 as well, so I figured it would be a good thing to re-list it here:
- MySQL Server, version 5.0+ Community Edition (or other DB that supports the "if" function )
- MySQL Connector/J, JDBC Driver for MySQL, version 3.1.2
- Pentaho Design Studio (PDS) version 1.2 RC2 or later.
- Pentaho Pre-configured Installation (PCI) running locally, and the hypersonic database running locally with the SampleData database, version 1.2 RC2 or later.
- Kettle, version 2.3.0 (for migrating the Pentaho sample data into MySQL)
In addition, we are now going to build a Pentaho report, so you will want to have the following tools as well:
- Pentaho Report Design Wizard, version 1.2 RC2 or later.
You will also need the solution files that we created in Part 1 of the article, downloadable here. If you want the solution in its entirety, including those files we will create in this article, then download this archive.
Let's get back to it then.
Step-By-Step
It's important at this point that you have the PCI, the Pentaho Design Studio, the Pentaho Report Design Wizard and Kettle installed and ready to run somewhere on your computer. If you have any questions on how to set these things up, they all have installation and user guides located at http://www.pentaho.org/download/latest.php. From here forward I will assume you have the necessary tools for the exercise.
Here are the major bits we have left to complete this exercise:
- We need to build the main report using JFreeReport and the Pentaho Report Design Wizard.
- We will break apart the report definition into a set of templates that can be re-assembled dynamically to display the correct number of columns, and derive a suitable report width to hold the columns selected.
- We will change the solution so that the report title is generated from the measures chosen - "Actual Expenses by Region and Position" if ACTUAL is selected, and "Budget Expenses by Region and Position" if BUDGET is selected.
- And finally, we will pass a string in the header of the response suggesting a "nice name" for our report, should the output type selected be of some other type besides html.
Building the Report
Our first goal is to generate a Pentaho report based on the query that gets built after the measures and position title columns are selected. In order to capture that query, we will start by specifying hte query string (xTabQry) as an output to our main action sequence. The query will print to the screen, and we can capture it for use in designing our report.
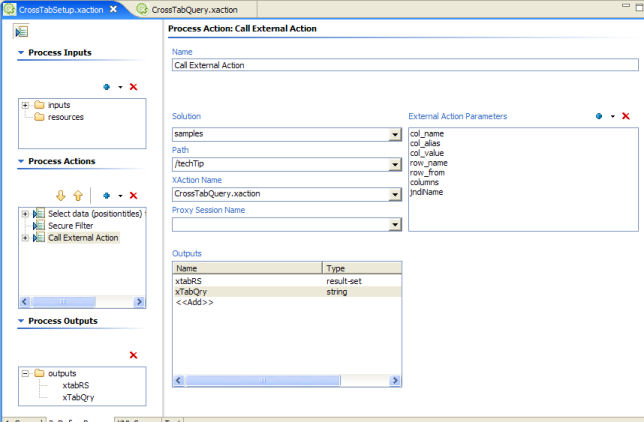
- Add the variable xTabQry (from the CrossTabQuery.xaction action sequence) as an output to the last Call External Action action.
- Drag the xTabQry output to the action sequence Outputs box, as shown:
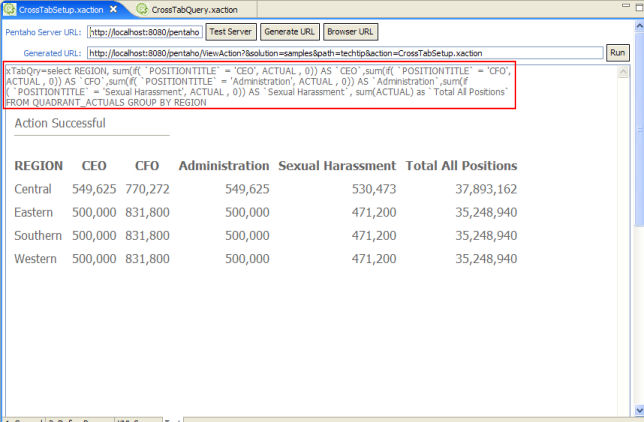
- Switch to the Test tab, select Generate URL, then run the action sequence by clicking the Run button.
- At the prompt page, select web page, ACTUAL and 5 different positions (this is pretty random - selecting 5 just gives us a nice report to start with).
- Once you submit the prompt page, you should see the resulset of the query, and at the top of the page, the query string. Copy and paste the query string into a text editor.
Now that we have the query, we can use the Pentaho Report Design Wizard to quickly generate the meat of the report for us.
- Before starting the Report Design Wizard, make sure the wizard has the MySQL jdbc driver library, so that you can connect to the MySQL sampledata database. This is as simple as copying the mysql-connector-java-3.1.12-bin.jar file into the \lib\jdbc directory under the Report Design Wizard's install directory.
- Launch the Report Design Wizard. If you are not familiar with the Report Design Wizard, you should review the user guide before going any further.
- In Step 1, name your report "Cross Tab Report", and select the "basic.xreportarc" template. This template will provide some decent formatting for our report.
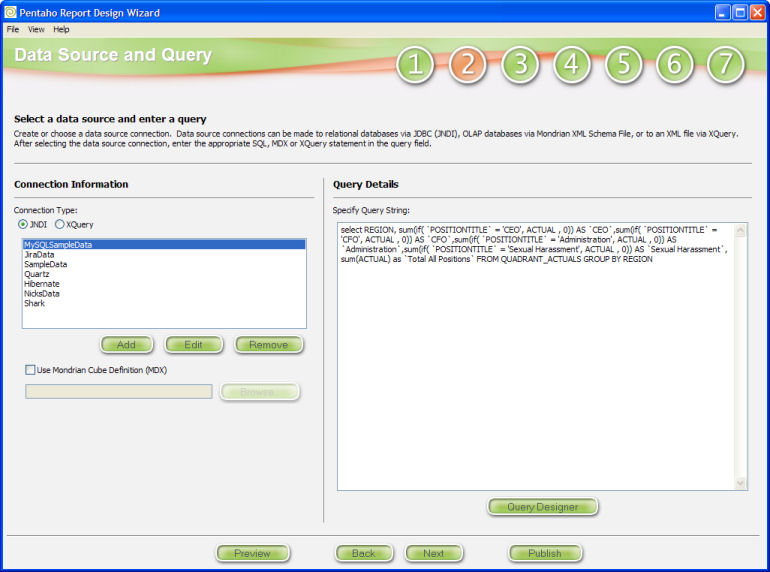
- Step 2 requires that you set up the JNDI information to connect to the MySQL sampledata database that we created in Part 1 of this article. Remember that the name of our JNDI connection is "MySQLSampleData" (from Part 1).
- Choose the "JNDI" connection type, and click the "Add" button.
- Enter "MySQLSampleData" as the JNDI name, or whatever name you used in the first part of this article, if you chose something different.
- Enter the rest of your database connection parameters, as the dialog requests. Click the "Test" button to be sure you can connect to the database. Select OK when finished.
- Once you have set up your JNDI connection, it should appear in the list of JNDI connections in Step 2. Select the JNDI connection we just created, and then paste the query that we saved off in the text editor in the query box. Select Next. You will receive a warning message "Report meta-data does not match the current result-set; update report spec?"; choose "Yes".
- Steps 3, 4, 5, and 6 require no changes, so choose Next through the wizard until you are on Step 7.
- On Step 7, change to the Expressions tab, and uncheck "Calculate Grand Totals".
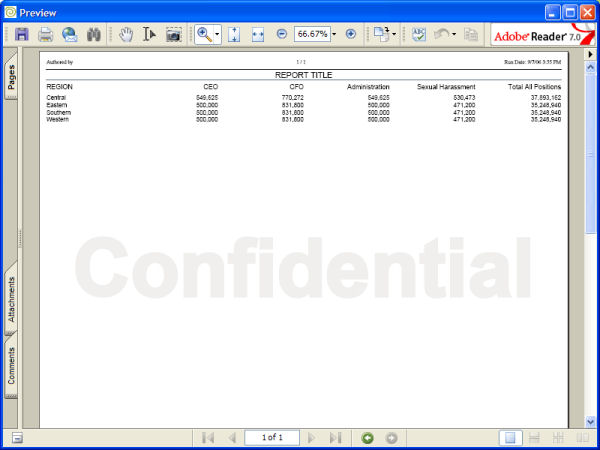
- Choose Preview. Your report should look very similar to the following screenshot:
- And last, we want to publish our report.
- Close the Preview window, and select the Publish button at the bottom of the wizard.
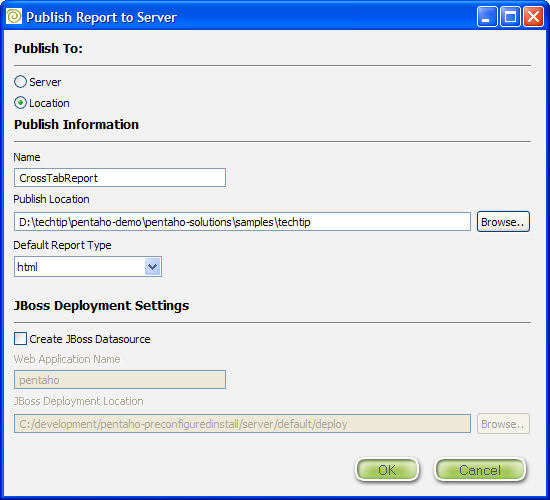
- In the Publish dialog, choose Publish to Location.
- Change the name of the report to CrossTabReport, with no spaces. Otherwise the report files will have spaces in them, which we do not want!
- In the Publish Location box, navigate to the techtip folder under the PCI demo's solution folders. This is the same location where our current set of action sequences from Part 1 are located.
- Choose "html" as the Default Report Type.
- Uncheck the "Create JBoss Datasource" option, since we already havce JNDI datasource defined for the MySQL sampledata (did that in Part 1).
- Click OK.
- You should now have several files, including the JFreeReport report definition file in the /techtip solution folder. The only file we want to keep is the JFreeReport definition file, which is named CrossTabReport.xml. Delete all of the other files that were generated by the publish, all of which start with CrossTabReport.*.
From Report to Report Templates
What we want to do next takes a bit of explaining. The report definition that we just generated is built to accept a query that returns 4 columns. The report we want to end up with will handle a variable number of columns, those that the user selects at runtime. So we need to identify those parts of the report responsible for displaying the columns, and pull them out so that they can be built up to the requested number of columns on the fly. This will also require that we pass in the report width as a parameter, so that the report expands to allow enough room for all of the columns.
CAUTION: Here is where you must exercise caution and care, because we are going to be taking apart XML by hand. Manually editing XML is frought with potential errors, which is why most applications build UIs to shield you from this danger zone. We are getting there, but still have these few exposed areas.
- Open the CrossTabReport.xml file, either in your favorite text editor, or in an XML editor, should you be so lucky as to have such a tool.
- Scroll down until you find the XML element <items>. The block you are looking for will look similar to the chunk of XML below:
<items color="#000000" fontname="Arial" fontsize="9" fontstyle="plain">
<string-field name="REGIONElement" nullstring="-" fieldname="REGION" vertical-alignment="middle" alignment="left" width="16.666666666666668%" x="0.0%" y="0" height="11"/>
<number-field name="CEOElement" nullstring="-" fieldname="CEO" vertical-alignment="middle" alignment="right" width="16.666666666666668%" x="16.666666666666668%" y="0" height="11"/>
<number-field name="CFOElement" nullstring="-" fieldname="CFO" vertical-alignment="middle" alignment="right" width="16.666666666666668%" x="33.333333333333336%" y="0" height="11"/>
<number-field name="AdministrationElement" nullstring="-" fieldname="Administration" vertical-alignment="middle" alignment="right" width="16.666666666666668%" x="50.0%" y="0" height="11"/>
<number-field name="Sexual HarassmentElement" nullstring="-" fieldname="Sexual Harassment" vertical-alignment="middle" alignment="right" width="16.666666666666668%" x="66.66666666666667%" y="0" height="11"/>
<number-field name="Total All PositionsElement" nullstring="-" fieldname="Total All Positions" vertical-alignment="middle" alignment="right" width="16.666666666666657%" x="83.33333333333334%" y="0" height="11"/>
</items>
- We want to copy only the <stringfield ... /> element out of that block, and paste it into a new file, named xtab-item-band.xml. This one XML element, after we make some tweaks will be the template that we repeat to represent each item of data in the report.
- Now we will use replaceable parameters in our new item band template (x-item-band.xml), so that later, we can programmatically create as many item fields for as many columns as we choose.
- In the xtab-item-band.xml file, change the value of the name attribute on the stringfield element to be {colName}Element (no spaces). We will pass in the colName for each column.
- Change the value of the fieldname attribute on the stringfield element to be {colName}. We will pass in the colName for each column.
- Change the value of the alignment attribute to be "right". This is for aesthetic purposes; just looks nicer

- Change the value of the width attribute to be "85". Making the column widths absolute has its drawbacks, but it will help us more easily determine the report width in the end.
- And last, change the value of the x attribute to be {xPos}. This is the absolute x position for each column, which we will calculate programmatically and pass in.
- Your result XML should resemble the following:
<string-field name="{colName}Element" nullstring="-" fieldname="{colName}" vertical-alignment="middle" alignment="right" width="85" x="{xPos}" y="0" height="11"/>
- Now,return to the CrossTabReport.xml file. We want to comment out the elements inside the <items> element and replace those elements with a replaceable parameter, named {itemBand}. We will pass in the needed XML for this block once we have dynamicaly generated it. The itemBand parameter is a place holder for that block of XML.
<items color="#000000" fontname="Arial" fontsize="9" fontstyle="plain"> {itemBand} <!-- <string-field name="REGIONElement" nullstring="-" fieldname="REGION" vertical-alignment="middle" alignment="left" width="16.666666666666668%" x="0.0%" y="0" height="11"/> <number-field name="CEOElement" nullstring="-" fieldname="CEO" vertical-alignment="middle" alignment="right" width="16.666666666666668%" x="16.666666666666668%" y="0" height="11"/> <number-field name="CFOElement" nullstring="-" fieldname="CFO" vertical-alignment="middle" alignment="right" width="16.666666666666668%" x="33.333333333333336%" y="0" height="11"/> <number-field name="AdministrationElement" nullstring="-" fieldname="Administration" vertical-alignment="middle" alignment="right" width="16.666666666666668%" x="50.0%" y="0" height="11"/> <number-field name="Sexual HarassmentElement" nullstring="-" fieldname="Sexual Harassment" vertical-alignment="middle" alignment="right" width="16.666666666666668%" x="66.66666666666667%" y="0" height="11"/> <number-field name="Total All PositionsElement" nullstring="-" fieldname="Total All Positions" vertical-alignment="middle" alignment="right" width="16.666666666666657%" x="83.33333333333334%" y="0" height="11"/> --> </items> - So that took care of the data field, but we also need to perform similar steps for the column labels. Scroll down until you find the XML element <band> with a name attribute of DummyGroupDataBandElement . The block you are looking for will look similar to the chunk of XML below:
<band name="DummyGroupDataBandElement">
<rectangle color="#dff4ff" draw="false" fill="false" height="18" width="100%" x="0%" y="0"/>
<label color="#000000" fontname="Arial" fontsize="10" fontstyle="plain" height="18" vertical-alignment="middle" alignment="left" width="16.666666666666668%" x="0.0%" y="0">REGION</label>
<label color="#000000" fontname="Arial" fontsize="10" fontstyle="plain" height="18" vertical-alignment="middle" alignment="right" width="16.666666666666668%" x="16.666666666666668%" y="0">CEO</label>
<label color="#000000" fontname="Arial" fontsize="10" fontstyle="plain" height="18" vertical-alignment="middle" alignment="right" width="16.666666666666668%" x="33.333333333333336%" y="0">CFO</label>
<label color="#000000" fontname="Arial" fontsize="10" fontstyle="plain" height="18" vertical-alignment="middle" alignment="right" width="16.666666666666668%" x="50.0%" y="0">Administration</label>
<label color="#000000" fontname="Arial" fontsize="10" fontstyle="plain" height="18" vertical-alignment="middle" alignment="right" width="16.666666666666668%" x="66.66666666666667%" y="0">Sexual Harassment</label>
<label color="#000000" fontname="Arial" fontsize="10" fontstyle="plain" height="18" vertical-alignment="middle" alignment="right" width="16.666666666666657%" x="83.33333333333334%" y="0">Total All Positions</label>
</band>
- We want to copy only the first <label ... /> element out of that block, and paste it into a new file, named xtab-top-band.xml. This one XML element will represent the labels for our columns.
- Now we will use replaceable parameters in our new top band template (x-top-band.xml).
- In the xtab-top-band.xml file, change the value in between the <label></label> to be {colName}. We will pass in the colName for each column.
- Change the value of the alignment attribute to be "right".
- Change the value of the width attribute to be "85".
- And last, change the value of the x attribute to be {xPos}.
- Your result XML should resemble the following:
{<label color="#000000" fontname="Arial" fontsize="10" fontstyle="plain" height="18" vertical-alignment="middle" alignment="right" width="85" x="{xPos}" y="0">{colName}</label>
- Now, return to the CrossTabReport.xml file. We want to comment out the elements inside the <band> element, excluding the <rectangle> element that appears right inside <band>. We'll replace those elements with a replaceable parameter, named {topBand}. We will pass in the needed XML for this block once we have dynamically generated it. The topBand parameter is a place holder for that block of XML.
<band name="DummyGroupDataBandElement"> <rectangle color="#dff4ff" draw="false" fill="false" height="18" width="100%" x="0%" y="0"/> {topBand} <!-- <label color="#000000" fontname="Arial" fontsize="10" fontstyle="plain" height="18" vertical-alignment="middle" alignment="left" width="16.666666666666668%" x="0.0%" y="0">REGION</label> <label color="#000000" fontname="Arial" fontsize="10" fontstyle="plain" height="18" vertical-alignment="middle" alignment="right" width="16.666666666666668%" x="16.666666666666668%" y="0">CEO</label> <label color="#000000" fontname="Arial" fontsize="10" fontstyle="plain" height="18" vertical-alignment="middle" alignment="right" width="16.666666666666668%" x="33.333333333333336%" y="0">CFO</label> <label color="#000000" fontname="Arial" fontsize="10" fontstyle="plain" height="18" vertical-alignment="middle" alignment="right" width="16.666666666666668%" x="50.0%" y="0">Administration</label> <label color="#000000" fontname="Arial" fontsize="10" fontstyle="plain" height="18" vertical-alignment="middle" alignment="right" width="16.666666666666668%" x="66.66666666666667%" y="0">Sexual Harassment</label> <label color="#000000" fontname="Arial" fontsize="10" fontstyle="plain" height="18" vertical-alignment="middle" alignment="right" width="16.666666666666657%" x="83.33333333333334%" y="0">Total All Positions</label> --> </band> - Now, we want to be able to set the absolute report width. To do this we need to remove a few of the <report> elements attributes, and add a replaceable parameter for the width.
- In the CrossTabReport.xml file, find (at the very top) the <report> element.
- Delete the pageformat and orientation attributes and their values. These attributes override the width attribute, so if left there, our width attribute will not be used.
- Add a height attribute, with a value of "700".
- Add a width attribute, with a value of {reportWidth}. We will calculate the report width programmatically and pass it to the report template at runtime.
- Your XML should resemble the following:
<report bottommargin="10" topmargin="10" rightmargin="10" leftmargin="10" height="700" width={reportWidth} name="CrossTabReport">
- Andfinally the last few modifications to the report template. We want to be able to pass in two more pieces of information to the report - the report title, and the report author. So we will create two more replaceable parameters in the main report template.
- In the CrossTabReport.xml file, find the <parser-config> element at the top of the file.
- Change the value for the Report_Title property to be {reportTitle}.
- Change the value for the pagefooter_left property to be Authored By {author}.
- Change the value for the pageheader_left property to be Authored By {author}.
- Your XML should resemble the following:
<report bottommargin="10" topmargin="10" rightmargin="10" leftmargin="10" height="700" width={reportWidth} name="CrossTabReport">
<parser-config>
<property name="Report_Title">{reportTitle}</property>
<property name="pageheader_left">Authored by {author}</property>
<property name="pageheader_center">$(PageofPages)</property>
<property name="pageheader_right">Run Date: $(report.date)</property>
<property name="pagefooter_left">Authored by {author}</property>
<property name="pagefooter_center">$(PageofPages)</property>
<property name="pagefooter_right">Run Date: $(report.date)</property>
<property name="watermark">Confidential</property>
</parser-config>
- And the report templating is done! Save all of your files, and we will move over to the action sequence where we will put all of the pieces together.
Dynamically Build Our Report Definition
Now that we have broken down our report definition into the necessary parts, we can write an aciton sequence that uses a little JavaScript to put it all back together with the number of columns we want and the data from our query. We will build this as a separate action sequence and call it from the main action sequence, since the operation we are performing are specific to building this report specification.
Here's what our action sequence needs to do:
- Define message template components to hold our item band and our top band templates.
- In Javascript, use the metadata from our query resultset and our message templates to build the XML for the column labels and fields.
- Use a main message template to put the item band, top band, author and report title information into our main report template, like putting the pieces of a puzzle together.
- The output of our action sequence will be string holding our full fledged report definition!
This is how we do it:
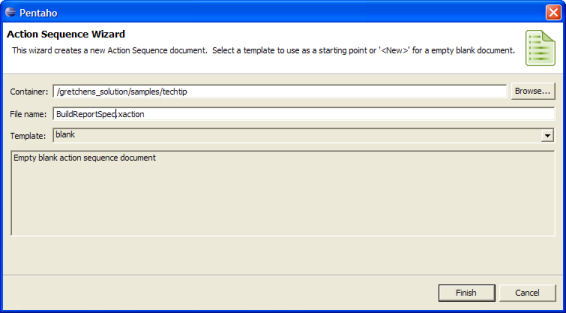
- Create a new action sequence using the Design Studio menu option BI Platform | New Action Sequence.
- In the dialog, enter the following information:
- For the Container, navigate to the /techtip directory that we have been working in in your solution folders.
- Name your action sequence BuildReportSpec.xaction.
- Leave the template as <blank>.
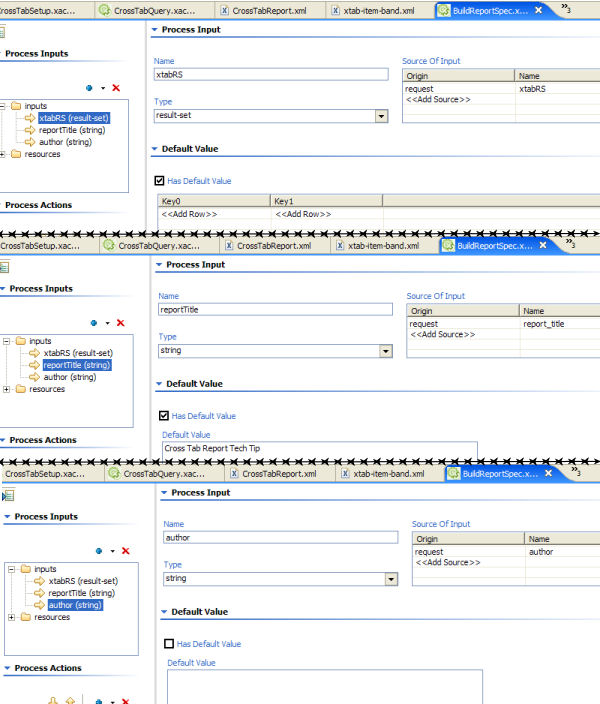
- First, we need some inputs and resources. We will want to accept the query resultset from the main action sequence, as well as the report title and the author. We also need to define a resource for each of the templates that we are going to use.
- Define a new resultset input, named xTabRS.
- Define a new string input, named reportTitle.
- Define a new string input, named author.
- These screenshots show these inputs defined:
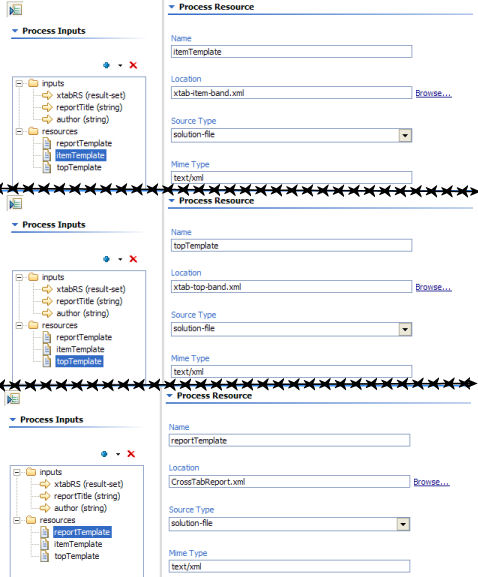
- Next up, our resources. Define a new resource that will hold the item band template. This resource is a solution-file (Source Type) with a Mime Type of "text/xml". For this resource's location, browse to the xtab-item-band.xml file that we created earlier.
- Define a new resource that will hold the top band template. This resource is a solution-file (Source Type) with a Mime Type of "text/xml". For this resource's location, browse to the xtab-top-band.xml file that we created earlier.
- And last, define a new resource that will hold the main report template. This resource is a solution-file (Source Type) with a Mime Type of "text/xml". For this resource's location, browse to the CrossTabReport.xml file that we created earlier. The screenshots below show these resources:
- Now that we have our resources and inputs, let's build our process. The first step is to use the message Template component to read in and hold our band templates. This will effectively read in the files and make them available to us as String objects later in JavaScript. Due to a bug in the Design Studio, we will have hand-edit the action sequence XML a bit, but no worries, I'll walk you through it.
- In the Define Process box, create a new Message Template. Name the template "Template to Read In Item Band". Name the output string "itemTemplate". Leave the message blank.
- Create another new Message Template. Name the template "Template to Read In Top Band". Name the output string "topTemplate". Leave the message blank.
- We need to map these actions (message templates) to the resources we defined in the Inputs section. This is the part that the Design Studio bug prevents us from doing in the UI. So switch over to the XML view (choose the XML Source tab) of the action sequence. Find the <actions> XML element. The XML you are looking for will look similar to this:
<action-definition> <component-name>TemplateComponent</component-name> <action-type>Template to Read In Top Band</action-type> <action-outputs> <output-message type="content" mapping="topTemplate"/> </action-outputs> <component-definition/> </action-definition> <action-definition> <component-name>TemplateComponent</component-name> <action-type>Template to Read In Item Band</action-type> <action-outputs> <output-message type="content" mapping="itemTemplate"/> </action-outputs> <component-definition/> </action-definition> - Add the following XML snippets to the XML.
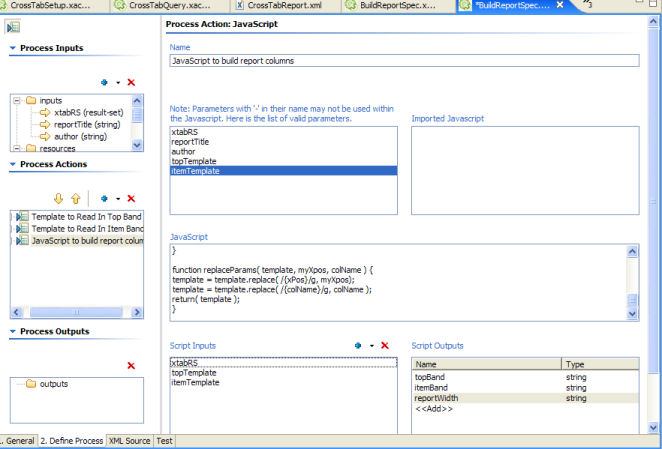
<action-definition> <component-name>TemplateComponent</component-name> <action-type>Template to Read Top Band</action-type> <action-resources> <template type="resource" mapping="topTemplate"/> </action-resources> <action-outputs> <output-message type="string" mapping="topTemplate"/> </action-outputs> <component-definition/> </action-definition> <action-definition> <component-name>TemplateComponent</component-name> <action-type>Template to Read Item Band</action-type> <action-resources> <template type="resource" mapping="itemTemplate"/> </action-resources> <action-outputs> <output-message type="string" mapping="itemTemplate"/> </action-outputs> <component-definition/> </action-definition> - Switch back to the Define Process view. The next action, a JavaScript action, does all of the heavy lifting. Create a new JavaScript action and name it "JavaScript to build report columns". The logic behind the JavaScript is to use the resultset metadata to access the name od each column, determine the X value for each column in the report and accumulate a total report width. The replaceParams() function takes advantage of the String object's ability to use regular expressions to do string replacements. The end result is that the topBand and itemBand variables have fully built XML that we can use in our main report to display our columns.
- Add the xtabRS, topTemplate and itemTemplate as Script inputs. Switch to the XML view, and make sure the type attribute value for these inputs is "string". If it is "content", change it to "string".
- Add the following JavaScript to the new JavaScript action.
var meta = xtabRS.getMetaData(); var colCount = meta.getColumnCount(); var colHeaders = meta.getColumnHeaders(); //getColumnHeaders() returns object[][] var colName = "temp_Name"; var xPos = 85; //must be an int b/c when used for ReportWidth must be an int topBand = ""; itemBand = ""; lineWidth = xPos * colCount; reportWidth = "\""+ lineWidth + "\""; var i = 0; //the first column for ( i = 0 ; i < colCount ; i++ ){ colName=colHeaders[0][i]; myXpos = xPos * i; topBand += replaceParams( topTemplate, myXpos, colName ); itemBand += replaceParams( itemTemplate, myXpos, colName ); } function replaceParams( template, myXpos, colName ) { template = template.replace( /{xPos}/g, myXpos); template = template.replace( /{colName}/g, colName ); return( template ); } - Add topBand, itemBand and reportWidth as outputs from the JavaScript, all as type string. .
- Your JavaScript action should resemble the following screenshot:
- Our last step for this action sequence is to complete the report definition by piecing it all back together. A Message Template makes this easy for us, although once again we will need to manipulate the action sequence XML due to the previously mentioned bug with resource mapping.
- Define a new Message Template, and name it "Template to create report spec". Name the output string "myReportSpec".
- Switch over to the XML view (choose the XML Source tab) of the action sequence. Find the <actions> XML element. The XML you are looking for will look similar to this:
<action-definition> <component-name>TemplateComponent</component-name> <action-type>Template to create report spec</action-type> <action-outputs> <output-message type="content" mapping="myReportSpec"/> </action-outputs> <component-definition/> </action-definition> - Add the following XML snippets to the XML.
Notice that we pass as inputs all of the bits that we need to fill in all of the replaceable parameters that we built into our report template. The Message Template will "glue" all these bits of information together for us, giving us a completely filled in report spec.
<action-definition>
<component-name>TemplateComponent</component-name>
<action-type>Template to create report spec</action-type>
<action-inputs>
   <topBand type="string"/>
   <itemBand type="string"/>
   <reportWidth type="string"/>
   <reportTitle type="string"/>
   <author type="string"/>
</action-inputs>
<action-resources>
   <template mapping="reportTemplate"/>
</action-resources>
<action-outputs>
   <output-message type="string" mapping="myReportSpec"/>
</action-outputs>
<component-definition/>
</action-definition>
- Now that we have the reportspec built, all we need to do is specify the myReportSpec string as the output for this action sequence, and plug it in to our main action sequence, the CrossTabSetup.xaction.
- Drag the myReportSpec variable from the last message template in the Actions box to the action sequence Outputs box. Save this action sequence.
- Switch over to the CrossTabSetup action sequence (CrossTabSetup.xaction).
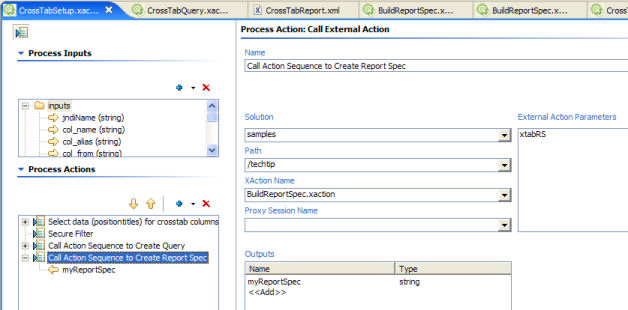
- Add a Call External Action action to the end of the process. Name it "Call Action Sequence to Create Report Spec".
- Add xtabRS as an External Action Parameter.
- Enter samples for the solution container.
- Enter /techtip for the path.
- Enter BuildReportSpec.xaction as the action sequence.
- Enter myReportSpec (type string) as the action output.
- Your new action in the sequence should resemble this screenshot:
- One more action is necessary in our process before we can test all that we have done. We need to define a JFreeReport action, to read our report definition, and display our report.
- Add a new JFreeReport Report action. Name it "The Cross Tab Report!"
- Leave the Report Spec blank. We will map the output of our last action to the report spec for this action at the step in this task.
- For Report Data, choose the xtabRS resultset.
- For Report Format, choose <type_out>.
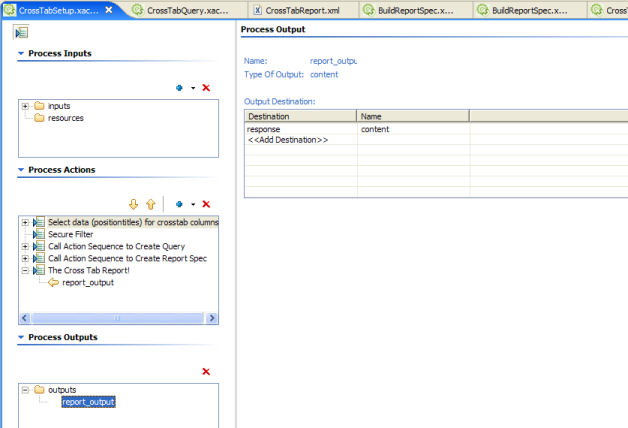
- For Report Destination, type report_output. This will be the output of the main action sequence.
- Switch to the XML view, and find the XML for this action (search for <actions>, then the name of this action.). Add the following line of XML as a child of the <action_inputs> element, which will map our myReportSpec variable to the report definition for this Report action.
<action-definition>
<component-name>JFreeReportComponent</component-name>
<action-type>The Cross Tab Report!</action-type>
<action-inputs>
   <report-definition type="string" mapping="myReportSpec"/>
   <data type="result-set" mapping="xtabRS"/>
   <output-type type="string" mapping="type_out"/>
</action-inputs>
<action-outputs>
   <report-output type="content" mapping="report_output"/>
</action-outputs>
<component-definition/>
</action-definition>
- Drag the report_output variable from the last action in the Actions box to the Output box for the CrossTabSetup action sequence. For the destination of this output, choose "response" as the destination, with "content" as the name. Save your action sequence, we are now ready to test it!
- We have built alot, now we have our first opportunity to test our solution.
- Make sure that your PCI server is up and running.
- Switch from the Define Process tab to the Test tab in Design Studio .
- At the top of the Test screen, you should see the URL to your PCI server. If you are not sure whether that is the correct URL, click the Test Server button. If you then see the PCI home page, then the server URL is correct.
- Click the Generate URL button. This should generate the URL needed for testing your action sequence.
- Last, click the run button at the end of the URL location text box. You should be prompted for the report format, yor measures, and the position columns that you would like in yor report. Make some selections and submit the report. If all is well, you should see a report similar to this screenshot:
Don't get discouraged if you have a few exceptions at first, since we have tweaked alot of code, it's very possible we have a few typos or other mistakes. You should be able to logically find your problems with the errors that are reported. If you are really struggling, you can always compare your solution with the completed solution files.
Generating the Report Title
So far, our report looks really good, but you can see that we probably want a better report title than "Default Report Title". We also should pass the appropriate author information to the report as well. The report title will be derived from the measure chosen by the user from the prompt page. If the user chose "Actual Expenses", the report title should be "Actual Expenses by Region and Position". If the user chose "Budget Expenses", the report title should be "Budget Expenses by Region and Position".
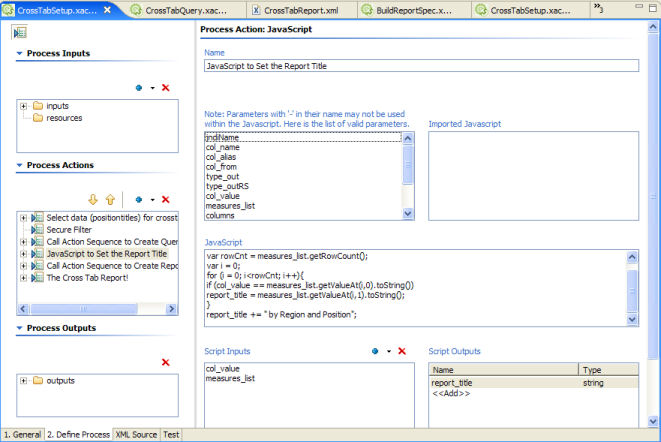
- Right after the Call to External Action to create the report query (before the sub-action to create the report spec), create a new JavaScript action. Name the action "Javascript to Set the Report Title".
- Select col_value and measures_list as script inputs.
- Enter the following JavaScript in the JavaScript box. This script will match the selection in col_value (which is the variable holding the measure that the user selected) with it's entry in the measures_list, and return the display name for that measure, which is the value we want to use in the report title.
var report_title = ""; var rowCnt = measures_list.getRowCount(); var i = 0; for (i = 0; i<rowCnt; i++){ if (col_value == measures_list.getValueAt(i,0).toString()) report_title = measures_list.getValueAt(i,1).toString(); } report_title += " by Region and Position"; - Enter report_title (as a string) as the output from the script. Your JavaScript action should look as follows:
- Highlight the "Call Action Sequence to Create Report" action. Add report_title to the External Action Parameters.
- And finally, open the BuildReportSpec.xaction file. Highlight the reportTitle Input in the Inputs box.
- In the Source of Input, where request is defined as the Origin, change the Name to report_title.
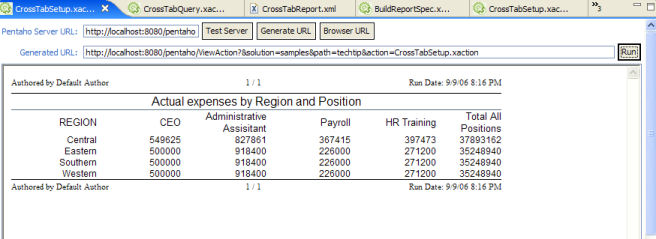
- Save all files, and re-test the CrossTabSetup action sequence. The report title should look like this:
Naming the Output File
And the final task we want to accomplish - giving any generated files a nice name. If we don't change anything, the file name for output files would in the best of cases take on the name of the servlet from which we are running. What we really want is to give the file a logical, descriptive name. We will use JavaScript to generate a a file name using the report title.
- Right after the Javascript to "Set the Report Title" JavaScript action, create a new JavaScript action. Name the action "JavaScript to Create Attachment Name".
- In the Script Inputs box, add type_out and report_title. You can select both of these from the plus sign in the top right corner of the box. The report_title will give us the name of our file, and the type_out will provide the appropriate file extension to add, depending on the file format the user chose.
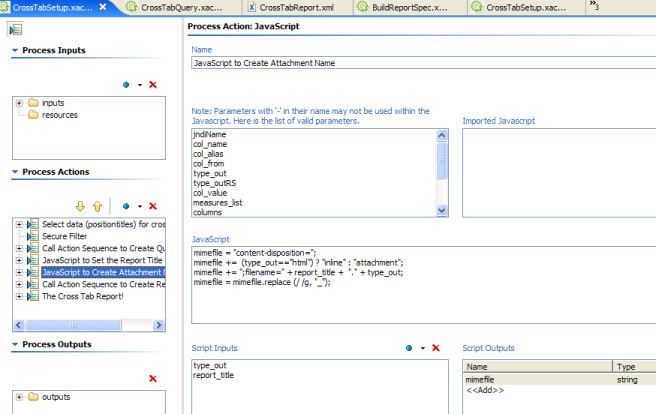
- Add the following JavaScript to the JavaScript box:
mimefile = "content-disposition=";
mimefile += (type_out=="html") ? "inline" : "attachment";
mimefile += ";filename=" + report_title + "." + type_out;
mimefile = mimefile.replace (/ /g, "_");
- In the Script outputs box, enter mimefile as type string. Your JavaScript action should resemble the following screenshot:
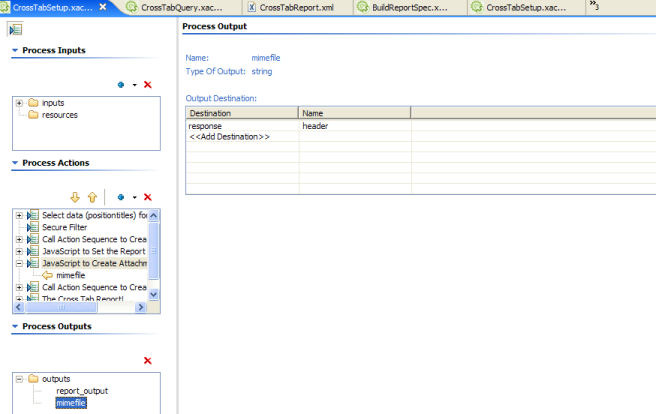
- Now, expand the "JavaScript to Create Attachment Name" action, so that you can see the mimefile output. Drag mimefile from the Prcess Actions box to the outputs in the Process Outputs box.
- Highlight mimefile in the Process Outputs box.
- Add a destination of type response, with the name "header". This will add our mimefile string into the header of the request to the browser, giving the browser the file information we want it to recieve.
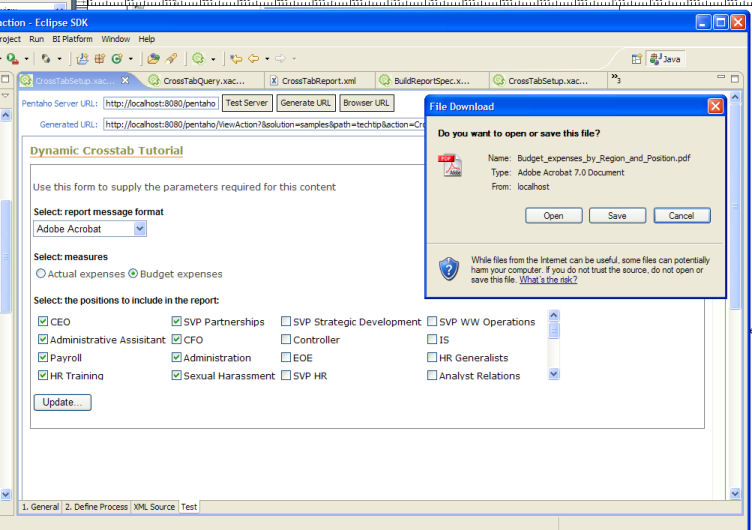
That's everything! Now, when you re-test your action sequence, you should a pretty name for any files that are not html format. Here is an example:
You may have noticed that I skipped the step where we pass the author information to the report. I am intentionally leaving that as an exercise for the reader, since we have done so much parameter passing, it should be a cinch to figure that one out by now. If you have any troubles, you can consult the complete solution to this exercise here.
I hope this is a rewarding exercise for all who try it, it has been fun helping Nic put this together.
