Evaluating Pentaho Analysis
March 25, 2008 - updated 11/17/2009
Contributed by Mike Tarallo, Pentaho Pre-Sales Director
Evaluating Pentaho Analysis Using Your Own Data
Pentaho Analysis is built on the popular Mondrian OLAP engine. The Pentaho BI Platform embeds the Mondrian engine as part of its architecture. Along with the Pentaho BI Platform, the Mondrian engine processes MDX requests with the ROLAP (Relational OLAP) schemas. These schema files are XML metadata models that are created in a specific structure used by the Mondrian engine. These XML models can be considered cube-like structures which utilize existing FACT and DIMENSION tables found in your RDBMS. It does not require that an actual physical cube is built or maintained; only that the metadata model is created. The structures and related API are outlined in the Mondrian Technical Guide that accompanies the Mondrian distribution as well as the Schema Workbench.
This XML-based metadata structure can be created using a text editor or the Schema Workbench. I have found the Schema Workbench to be the best tool for this task; After the schema is created and published to the Pentaho BI Server there are some additional steps necessary to create the Pentaho Analysis View.
The Mondrian Schema Workbench was originally created by a few organizations to easily create Mondrian Schemas to be used with the Mondrian Analysis engine. Pentaho has updated the Schema Workbench with additional stabilization, validation and Pentaho BI Server publish capabilities to work with the Pentaho BI Suite. The "Mondrian" Schema Workbench is the "recommended" design tool included with the Pentaho design tools suite to create a Mondrian Schema. A Mondrian Schema is really nothing more than an XML document that the Mondrian Analysis engine uses. (You could essentially manually develop a Mondrian schema using Windows Notepad, but would still have to manually deploy this to the server.) The Mondrian Analysis engine is embedded as part of the complete Pentaho BI Platform. Documentation for the actual Mondrian Schema design can be found at the links below, or in the Mondrian Technical guide (located in the Schema Workbench installation "..\design-tools\schema-workbench\doc". The Mondrian Schema Workbench is really nothing more than a properties editor which easily creates the Mondrian schema "and" publishes it to the Pentaho BI Server to be accessed by the Pentaho User Console.
To make this a bit easier for people evaluating Pentaho Analysis, a few resources were created. These were designed to help one evaluate and understand some of the fundamentals of the Pentaho Analysis offering. However, training is available to further your knowledge on the subject: http://www.pentaho.com/services/training/
Pentaho Analysis Services Mondrian Project
Pentaho Analysis Product Offering
This document is based on the following assumptions:
- You have a properly installed and configured Pentaho BI Server
- Oracle data was used for this example(you can use whatever data source you want, I just used Oracle and its sample data for this example)
Note: When using Oracle JDBC data connections make sure you use "thin" not "oci" as in: jdbc:oracle:thin:@localhost:1521:XE - use your appropriate SID in this connection
- There is one fact table and some dimension tables
- References provide supplementation when additional information may be necessary
- The Java application server being used is Tomcat
- Your application server and the way Java JNDI data sources are configured may vary
- Java 1.5 must be used for the Schema Workbench to run
- You can download the Oracle DDL .sql script and upload this with Oracles SQL Script tool: here
- The sample Mondrian schema file can be downloaded here.
(If you choose to use this file and open it in Schema Workbench,
make sure you select the appropriate Schema ID, that you imported the sample data into.)
Creating a Pentaho Analysis View Using the Schema Workbench
Follow the five basic steps below when creating a Pentaho Analysis View using the Schema Workbench to create the ROLAP model:
- Configure your Pentaho BI Server data source using the Pentaho Admin Console
- Create your Pentaho Analysis Schema Model using Schema Workbench
- Publish your Pentaho Analysis Schema Model to the Pentaho BI Server
- Use the Pentaho User Console to Create a New Analyzer Report (Enterprise Edition) or Analysis View (Community)
- Execute the Pentaho Analysis view
Creating your Pentaho Analysis Schema Using the Schema Workbench
Follow the instructions below to create your schema:
- Download and unzip the Schema Workbench
- Ensure your JDBC driver is in <drive>:\workbench-<version>\drivers directory
- Copy your JDBC driver to that folder if necessary. For example for Oracle 10g, the latest ojdbc14.jar file (found from Oracle's Web site) to that location were copied.
- Follow the schema_workbench.pdf documentation; it can be found in the "doc" sub-directory: <drive>:\workbench-<version>\doc.
- You will find that the best way to learn how to create a simple schema using the Schema Workbench is to open an existing *.mondrian.xml file provided with the Pentaho Open BI Server, such as the one found in the <dirve>:\biserver-ee\pentaho-solutions\steel-wheels\analysis\steelwheels.mondrian.xml
Note: The sample *.mondrian.xml files require you to place the Hypersonic or MySQL JDBC driver in the "drivers" directory and set up the appropriate connection URL and CLASS in Tools > Preferences section prior to opening them.

- More advanced users can use the Mondrian Technical Guide documentation as a reference to understand what the Mondrian structures are. When developing using the GUI please note that you can add additional elements that the Schema Workbench might not expose in the GUI. These items can be added in the actual XML code that is generated.
- Additional reference material can be found here: http://mondrian.pentaho.org/documentation/doc.php
Creating a Simple Schema
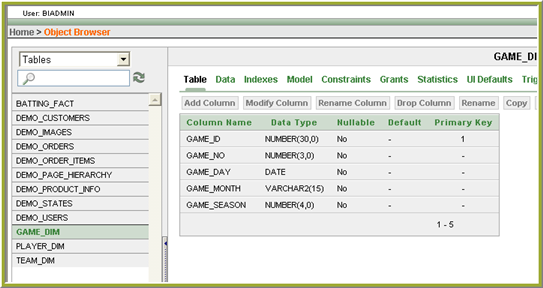
Make sure data types used in the schema are appropriate with what is in your RDBMS. Sometimes dates in RDBMS need to be defined as Strings in the schema design depending on how your RDBMS reads and uses the date data type. Notice in the example below that GAME_DAY is a DATE, GAME_MONTH is a VARCHAR, and GAME_SEASON (which is YEAR) is a number. Make sure your data types in the schema match accordingly.
Follow the instructions below to create a simple schema:
- Go to Tools > Connection to enter your JDBC parameters for your RDBMS

- Make sure the database is running, click Test Connection, if successful click Accept
- If an error occurs, start the database, and repeat step 2
- Go to File > New > Schema to name the schema in name attribute value.
- Right-click Schema > Add Cube to name the cube in name attribute value.
- Select Right Click, Add Table, enter schema ID, if applicable, and the fact table name.
- Make sure that Table: displays Table:<your_fact_table_here>.
- Right-click the cube name and select Add Measure.
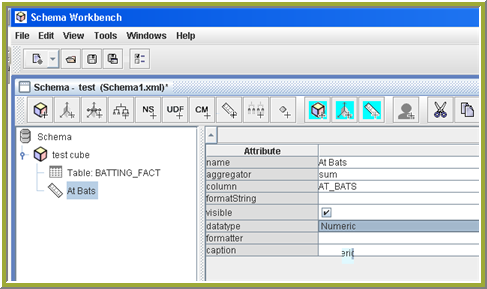
- Name the measure, select an aggregator such as sum; select the column and data type.
- Right-click the cube name and select Add Dimension.
- Select the appropriate foreign key and dimension type such as a Standard Dimension or Time Dimension.
- Expand the newly created dimension and select Hierarchy.
- Remove the name the hierarchy, the word "default" will appear
- Right click "default", select Add Table, select the schema and the Table name
- Right-click Hierarchy and add level.
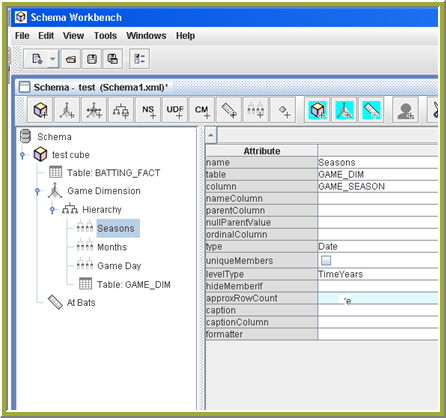
- At minimum, select the Name level, and the column. Sometimes it is necessary to specify the levelType for certain date dimension data types to work correctly.
- Repeat step 15 and 16 for different dimensional levels.
Publishing and Testing Your Analysis Schema on the Pentaho BI Platform
Test
- File, New, MDX Query
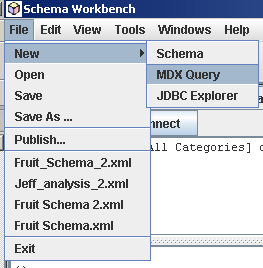
- Enter query in query window on top following this usage example:
MDX Usage: select [<Dimension name>].[<Hierarchy name] on columns from [<Cube name>]
MDX Example:
select NON EMPTY
ON COLUMNS,
NON EMPTY
ON ROWS
from [ADP Cube]
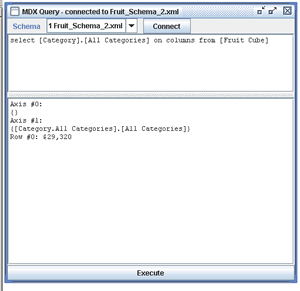
- (make sure the correct Schema is selected from the drop down or the Schema window is selected if you move the windows around)
- You should get something similar to this back:
\\\\Axis #0:
{}
Axis #1:
Axis #2:
Row #0: 20,440,000
Note: If query fails to return data then there may be an issue. Adjust the schema design accordingly and retest. Most common problems are the data types being used.
Publish
- File -> Publish
- Log in to the Pentaho Solution Repository using your user ID and publish password credentials
- Navigate to the Pentaho Solution folder location
- Provide the name of the Pentaho Database connection that you set up in the Pentaho Admin Console under the Pentaho or JNDI Data Source input box, leave register XMLA Data Source Checked
- Click Publish
Creating the Pentaho Analysis using the Pentaho User Console
- Log in to the Pentaho User Console using a web browser: http://localhost:8080/pentaho
- Select File, New, Analysis View
- Select the appropriate schema and cube that you published
- Click OK
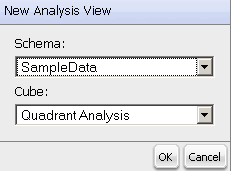
Your view will display in a tab to the right

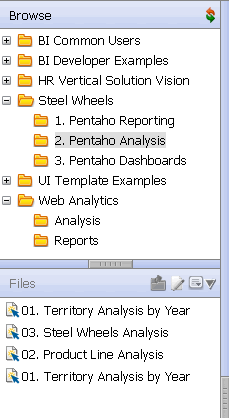
Once you sort, pivot, filter, etc. the view to your desire, you can then Save the view to the Pentaho Solution Repository using the blue floppy disk icons in the tool bar. (Your view may vary depending on the build you have)

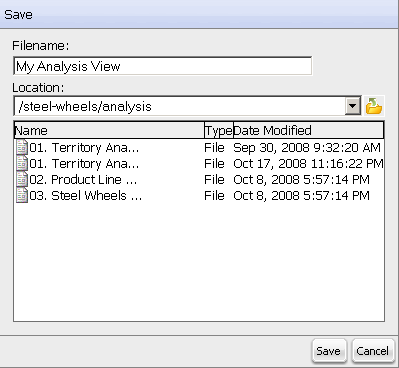
This view is now available to be access and manged in the Pentaho Solution Repository List
Create a new Analyzer Report (Enterprise Edition Only)
- Log in to the Pentaho User Console using a web browser: http://localhost:8080/pentaho
- Select File, New, Analyzer Report
- Select the appropriate schema and cube that you published from the drop down
- Click OK
For more detail check here to view the Analyzer Techcast.
Advanced ONLY: Once this view is save, it can be further enhanced and modified by using the Pentaho Design Studio
ADVANCED: A word on editing and then re-publishing or saving a Schema
Please note that any changes/updates/additions made to the ROLAP Analysis Schema using Schema Workbench or another editor (such as Design Studio or text editor) will require a refresh of the Pentaho Solution Repository and a refresh of the Mondrian Schema Cache. This can be done in the Pentaho User Console.
- Log in to the Pentaho User Console with an Admin equivalent ID
- Tools, Refresh, Repository Cache
- Tools, Refresh, Mondrian Schema Cache
These steps ensure that you are using the latest versions of the ROLAP schema when creating or using Pentaho Analysis Views.
Manually Creating or Editing a Pentaho Analysis View Action Sequence (advanced)
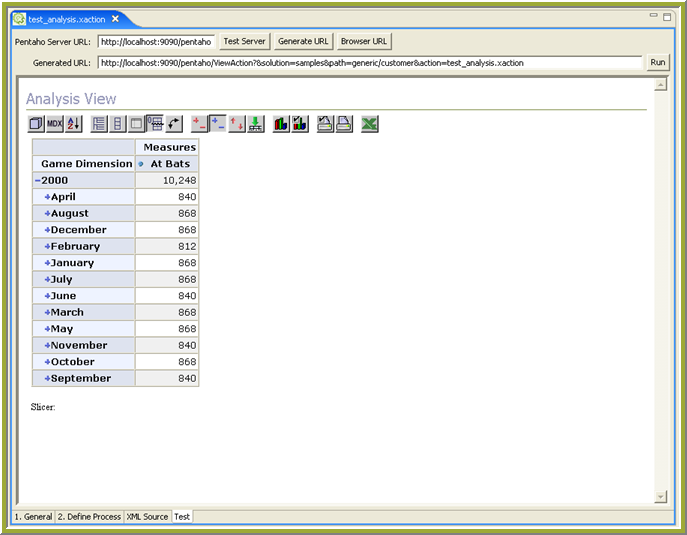
Follow the instructions below to create the action sequence manually that will display a Pentaho Analysis View. (This is a way where you can create the Pentaho action sequence manually to create the Pentaho Analysis View.) The advantage here is that you can have added control over the Pentaho Analysis query and the tool bar buttons available in the Pentaho Analysis Viewer. Users who are already familiar with Pentaho Design Studio and parameterized queries will be able to work with this section more effectively.
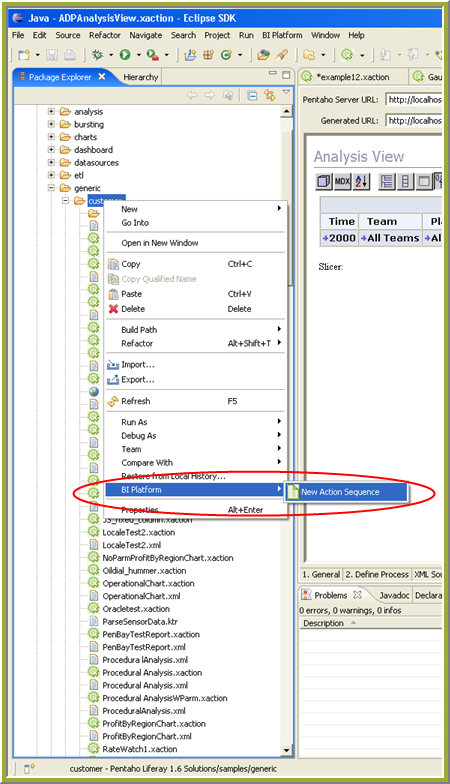
- In the Pentaho Design Studio, select your solution path, right-click the folder, and select BI Platform > New Action Sequence.
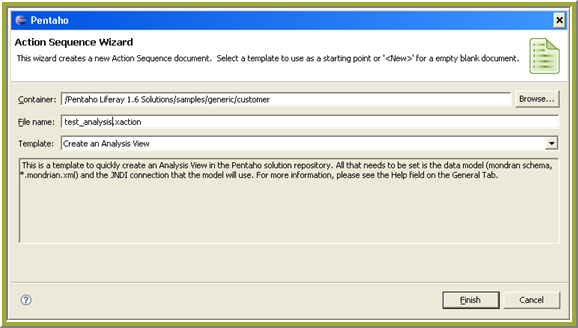
- Enter the name for action sequence
- Select Create Analysis View in the Template drop down and click Finish
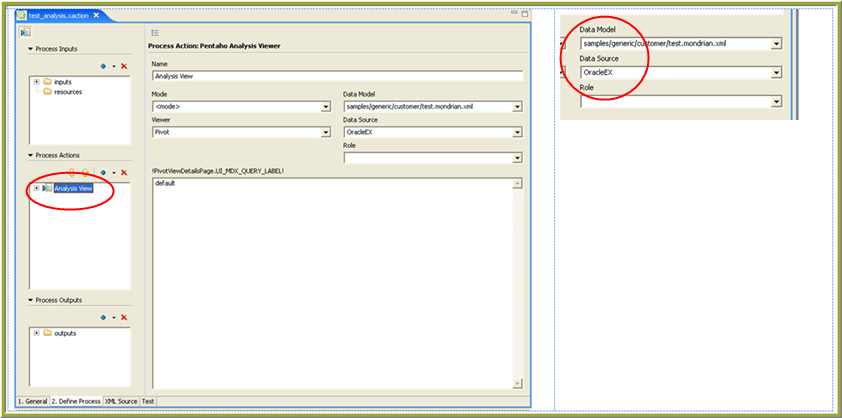
- Select Analysis View under Process Actions.
- Modify the Data Model and Data Source parameters accordingly. The Data Model is the path location and XML file you saved in Step 1 under Publishing your Analysis Schema Model on the Pentaho Open BI Server. The Data Source is the JNDI name you used when creating your data source in the section, Configuring your RDBMS JNDI data source on your application server, or the name you gave the data source in the Admin Console when using version 2.0 BI Server.
- Leave "default" as the query, later you can copy the MDX from the Analysis View MDX editor window and paste in
this query dialog to create parameterized and more advanced Pentaho Analysis Views.
- Save and test your Pentaho Analysis View using the URL with the appropriate solution= and path= directory names where you saved your .xaction and file.mondrian.xml files. You can use the TEST tab in Design Studio or copy and paste the URL into a browser or access it from the Pentaho Solution Repository via the Pentaho User Console.
