...
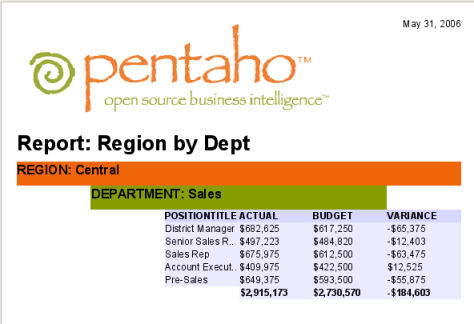
- Double-click on the Report Title and change it to "Report: Dept by Region".
- Click on the Group Header component that says "REGION: $(REGION)". In the Properties view in the lower right corner of the screen, click the Background property. Change the background color to 239;101;7. These are the RGB values, you can also use the ellipses button to select a color from the color chart.
- Click on the Group Header component that says "DEPARTMENT: $(DEPARTMENT)". In the Properties view in the lower right corner of the screen, click the Background property. Change the background color to 134;156;0. These are the RGB values, you can also use the ellipses button to select a color from the color chart.
- The ACTUAL, BUDGET and VARIANCE fields in the Item Band are by default created as text fields. This is also true for ItemSumFunctions in the Group Footer. We want these fields to be numeric. While holding down the <CTRL> key, click all six of the fields. Right-click on one of the highlighted items and select Morph | Morph Into Number Field. Now these fields will support numeric formatting.
- In the Properties view, click the Format property. Change its value to $#,##0. When the data is processed we'll see that it is formatted for USD.
- We'd also like to add page breaking after each group. To do this, browse the Structure view in the upper right corner of the screen. Open the Groups item in the tree until you see the DEPARTMENT_group. Open this group and click on its Group Footer. In the Properties view, check the property Page Break After.
- The final touch on this report is to change the font on the ItemSumFunction components to a bold font. Select all three elements using the same technique described previously. In the Properties view, click the Font property, and select Bold.
- Click the Preview button to view the report. There is no limit to the complexity of the reports that can be produced. I encourage you to explore the Palette view - notice that there are lines, images, bands and other features. These can be used to create very custom looks for reports.
This report may be saved in the Report Designer format, then later re-opened for editing. You can also generate JFreeReport XML and drop it into a Pentaho solution along with an action sequence and the report would now run in the Pentaho platform.

