An Introduction to Pentaho Agile BI
Important: This document is a collection of notes. It is a rough draft and therefore will undergo many changes prior to being published. The Agile BI project is in early development phase. The UI screenshots included in this document do not reflect the final look and feel of the product. has been moved to Documentation.
Agile BI Introduction
Pentaho Agile Business Intelligence, (from now on referred to as Agile BI), provides you with a set of tools that allows effective collaboration on BI project prototyping by members of an agile team. That team may be composed of ETL designers, business analysts, database administrators, IT developers, consultants, savvy technical users and more.
...
At its core, the Pentaho Agile BI, offers you an integrated solution that allows you and your team to move seamlessly go from ETL to modeling, from to reporting and data exploration to reporting, seamlessly. Competitor solutions require these process steps to occur separately through the use of individual tools and shown below:
Build data warehouse -> Massage the data using ETL tools -> Model the data using modeling tools -> Report and/or analyze data using reporting/analyzing tools
Using Pentaho Agile BI, the process above is integrated into one tool. Leveraging the power of Pentaho Data Integration (PDI), an ETL designer is able to massage data as needed, and, based on input from a business analyst, is able to go directly into modeling the data, visualizing and modeling the data, and finally to providing the data to users for self-serve reporting and analysis purposes. Because the ETL, modeling, visualizing, modeling, and reporting tools are integrated, it is easy for ETL designers and business analysts to work iteratively and to make needed changes to the data quickly and effectively. This allows BI projects to run more smoothly and cost effectively. Agile BI also allows the ETL designer to add modeling to his or her skill set thus reducing time allotted for proof-of-concept and prototype iterations. So, the process is more like the one described below:
While building a data warehouse, the ETL designer can immediately create a model based on data he or she has already built. The ETL designer can then explore (visualize) the data. For example, in cooperation with a BI analyst, the ETL designer may determine , (using visualization provided by Pentaho Analyzer), that certain dimensions are not applicable or that more hierarchies are required. The visualization step also allows data quality issues to be identified and corrected. At this point the ETL designer can return to Pentaho Data Integration PDI and build additional hierarchies, visualizemodel, then model visualize the data again. Adjustments can be made iteratively until the data is exactly what the BI analyst and end users want to see.
...
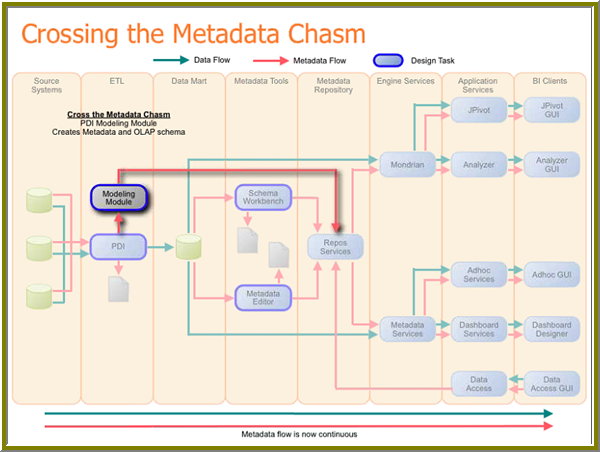
In the proposed architecture, Pentaho Data Integration will include a Modeling Module that generates the metadata necessary for Mondrian (Pentaho Analysis) and the metadata services. Pentaho Schema Workbench and the Pentaho Metadata Editor are bypassed allowing the ETL designer to go directly from PDI to the BI Server.
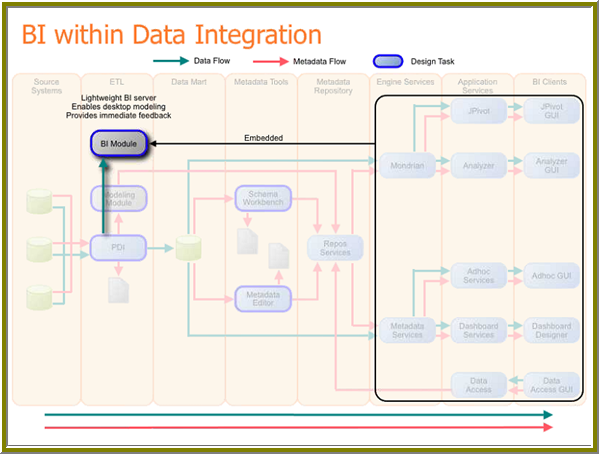
A The BI Model that will be embedded into Pentaho Data Integration is actually a trimmed down BI Server that allows the ETL designer, database administrator, or IT developer to perform data visualizations on the fly (locally, on the desktop or laptop) without having to publish the metadata to a BI Server; it also allows for quick end-to-end iterations without requiring a full BI Server installation.
Knowledge Prerequisites
To understand Pentaho Agile BI, you must...
Preliminary User InterfacePreliminary User Interface
The prototype images below do not reflect the "in development" user interface; however, the current development of the UI does follow the process flow outlined in the prototype images. The process flow demonstrates how a single person using a single tool can work with data, cleanse the data, enrich the data, visualize and tweak the data as needed to get immediate feedback from end users and team members. Finally, the ETL designer can publish the data to the BI Server so that the population of end users can use the data to create reports and dashboards.
User Interface, Step 1 -- Data source
User Interface, Step 2 -- Preview the data
User interface, Step 3 -- Transform the data
User Interface, Step 4 -- Start data visualization
User Interface, Step 5 -- Organize data according to the needs of your users
User Interface, Step 6 -- Identify data quality issues
User Interface, Step 7 -- Correct data quality issues
User Interface, Step 8 -- Verify corrected data quality issues
...
At this point, the ETL Designer can continue to add PDI steps that fine tune the dataset users want to see.
User Interface, Step 9 -- Begin modeling, visualize model
The samples above show the measure and dimension options. After building the model, you can immediately click Visualize to see the results.
Notice that you have gone from "discovery" to building the model and to visualizing the results. When you have tweaked the data sufficiently, you can publish the model to the BI Server.
User Interface, Step 10 -- Publish your model to the BI Server
The images below show how the model can be used in the BI Server. You can create charts and reports based on the model.


