...
- Requires the 1.5.0_06 Java Runtime Environment (JRE)
Installing Report Designer
...
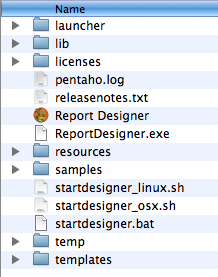
- Extract contents of the zip file into a folder.
- Read the Readme for important updates.
- In the Report Designer folder, click the file that is most appropriate for your operating system.
- Windows - ReportDesigner.exe
- Linux - startdesigner_linux.sh
- Mac OS X - Report Designer.app
...
The Pentaho Report Designer Version Checker
...
- Go to USER_HOME/.Report
- Find the file workspaceSettings.xml.
- Find the element, <property name="useVersionChecker">false</property>.
- Change the property value from "true" to false.
...
Report Designer Start Up
The Report Designer displays a Welcome page and a default workspace at start up. The Welcome page provides you with a brief introduction of the Report Designer and some instructions for getting started. The Welcome page also provides access to sample reports and recently opened reports. Click Design to open the report workspace.
...
- In the Structure panel, right-click Data Sources and select Add Data Source (formerly Add Pentaho Dataset). A window opens where you can configure the query used in the data source.
- Select SampleData and click the Query Designer. Make sure your Hypersonic database is running before doing so.
- Select PUBLIC from the Choose Schema list box. The SQLeonardo window is loaded. From this window, you can select the tables/views to be included in the data source.
- Select the PRODUCTS table by clicking PREVIEW. This allows you to visualize the data in the table quickly.
- Click OK to close both windows.
The data source is added to the report. The Properties tool window displays the available columns and the data type of each column. Click Configure to change the configuration of a data source. The data source is now set up and installed correctly. You must now define the look of the report.
The Report Definition
The report definition is what you compose in the main area of the graphical Report Designer. This definition provides the reporting engine with the location of each field on the report. The report definition consist of several sections called bands, such bands may include a report header, a page header, the item band and others.
The following image represents a schematic report as it may appear on the page:
The standard bands available in all reports are marked with different colors in the following image.
Red: the page header band. This band is usually printed at the top of each page
Green: the report header band. This band is printed once when the report starts
Blue: the item band. This band is printed for each row available in the data table
Turquoise: the report footer band. This band is printed once at the end of the report
Orange: the page footer band. This band is printed once at the bottom of each page
...
